Data Panel
The Splat Data panel visualizes the attribute values of the active splat as an interactive histogram. Use it to understand how values are distributed, find outliers, and select Gaussians whose values fall within a particular range. The panel's labels, like the status bar's, call individual Gaussians splats.
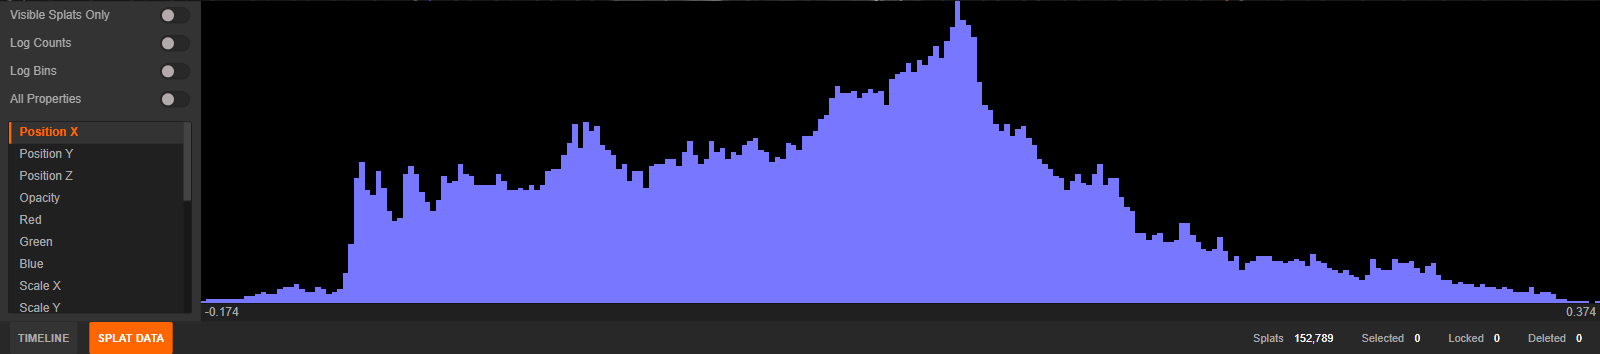
Opening the Panel
The panel opens at the bottom of the Editor and is collapsed by default. Open or close it by:
- Clicking Splat Data in the status bar.
- Pressing Ctrl+D (or Cmd+D on macOS).
Drag the panel's top edge to change its height.
Choosing Which Gaussians and Property to Display
The controls on the left determine which values are included in the histogram:
| Control | Description |
|---|---|
| Visible Splats Only | Includes only Gaussians inside the camera's current view. Gaussians outside the view are excluded. This is a view-frustum filter; it does not test whether other Gaussians are in front of them. |
| Log Counts | Uses a logarithmic vertical scale so bins with small counts remain visible alongside bins with large counts. This changes only the graph's vertical display, not the underlying values or selection. |
| Log Bins | Spaces the bins logarithmically along the value axis (negative values included), so groups of values spread across a large range stay distinguishable. Range selection still works on the real values. |
| All Properties | Adds raw DC and spherical harmonic (SH) coefficients to the property list. The available SH entries depend on the bands contained in the active splat. |
Select a row in the property list to display its distribution. The default properties are:
| Property | Description |
|---|---|
| Position X/Y/Z | World-space position after applying scene and per-splat transforms. |
| Opacity | Effective opacity, including any applied Colors transparency grade. Usually 0 to 1; merged Gaussians, such as those in decimated scenes, and a transparency grade that increases opacity can take it above 1, up to 1.5625. |
| Red/Green/Blue | Final color for the current camera direction, including spherical harmonics and any applied Colors grade. These histograms can change when the camera moves. |
| Scale X/Y/Z | Decoded Gaussian scale along each local axis. |
| Quaternion W/X/Y/Z | Components of the Gaussian's rotation quaternion. |
| Distance | Distance from the world origin (0, 0, 0). |
| Camera Depth | Distance along the current camera's view direction. This histogram changes when the camera moves. |
| Volume | scale_x * scale_y * scale_z. |
| Surface Area | A relative size measure calculated as scale_x² + scale_y² + scale_z². |
| Hue/Saturation/Value | HSV components calculated from the final color for the current camera direction. |
With All Properties enabled, the list can also include:
| Property | Description |
|---|---|
| DC R/G/B | Raw zeroth-order spherical harmonic color coefficients. These values do not include higher SH bands or an applied color grade. |
| R/G/B SH n | Higher-order spherical harmonic coefficients, grouped by color channel. Only coefficients present in the source data are listed. |
Locked and deleted Gaussians are always excluded from the histogram. Enable Visible Splats Only to exclude off-screen Gaussians as well.
Reading the Histogram
The histogram uses the Editor's unselected and selected colors to show the two populations separately. By default, unselected Gaussians are blue and selected Gaussians are yellow.
Move the pointer across the histogram to inspect a value. The value appears beneath the pointer, while an overlay shows:
- Splats - The number and percentage of included Gaussians at that value.
- Selected - How many of those Gaussians are currently selected.
When you drag across a range, the two values beneath the histogram mark the range boundaries and the overlay reports aggregate counts for the whole range.
Selecting a Value Range
Click and drag across the histogram to select all eligible Gaussians in a value range. A highlighted rectangle shows the range before you release the pointer. Locked and deleted Gaussians cannot be selected through the histogram.
Hold modifier keys when releasing the pointer to control how the range is applied:
| Modifier | Operation | Result |
|---|---|---|
| None | Set | Replace the current selection with the range. |
| Shift | Add | Add the range to the current selection. |
| Ctrl | Remove | Remove the range from the current selection. |
| Shift+Ctrl | Intersect | Keep only Gaussians that are in both the current selection and the range. |
The pointer displays the active Set, Add, Remove, or Intersect operation while it is over the histogram. These operations match the modifiers used by the 2D selection tools.
Status Bar Totals
The status bar below the panel reports the state of the active splat independently of the histogram's property and view filters:
| Statistic | Description |
|---|---|
| Splats | Total number of non-deleted Gaussians, including locked Gaussians. |
| Selected | Number of currently selected Gaussians. |
| Locked | Number of locked Gaussians. |
| Deleted | Number of deleted Gaussians. |
These totals update when Gaussians are selected, deselected, locked, unlocked, deleted, or reset.
Common Uses
Finding Outliers
Choose Distance, Opacity, Volume, or Surface Area, look for isolated bins at either end of the histogram, and select the relevant range for inspection or deletion. Enable Log Counts when a small number of outliers is hidden by much larger bins, and Log Bins when the values span several orders of magnitude.
Selecting by Color
Choose Hue, Saturation, or Value and select a range to isolate similarly colored Gaussians. Because these properties use the final view-dependent color, position the camera at the viewpoint that matters before making the selection.
Cleaning Only the Current View
Enable Visible Splats Only to restrict analysis and range selection to the camera's current view. Combine this with other selection tools when you need to refine the result spatially.
Value Interpretation
The panel displays decoded or derived values rather than every value exactly as it is stored in the source file:
| Property type | Interpretation |
|---|---|
| Position | World-space position after active transforms. |
| Scale | Decoded Gaussian scale; logarithmic source values have already been exponentiated. |
| Red/Green/Blue | Final color after evaluating available SH bands for the current view and applying any color grade. |
| Hue/Saturation/Value | Calculated from the final color after clamping RGB to the 0-1 range. |
| Opacity | Linear opacity (not the logit stored in standard 3DGS PLY files) with any transparency grade applied. |
| Quaternion W/X/Y/Z | Rotation quaternion; W is reconstructed in its non-negative canonical form. |
| DC and SH | Raw coefficients exposed when All Properties is enabled. |
Internal state and transform properties are not available for histogram visualization.